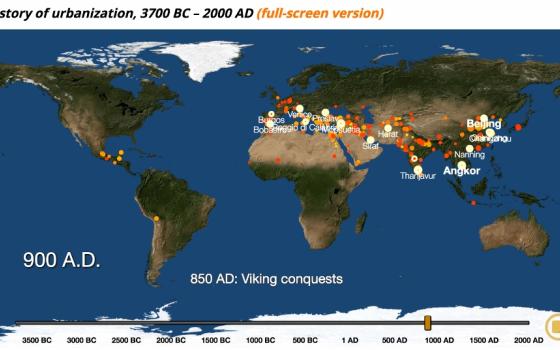
Screenshot of interactive map by Max Galka from Metrocosm.
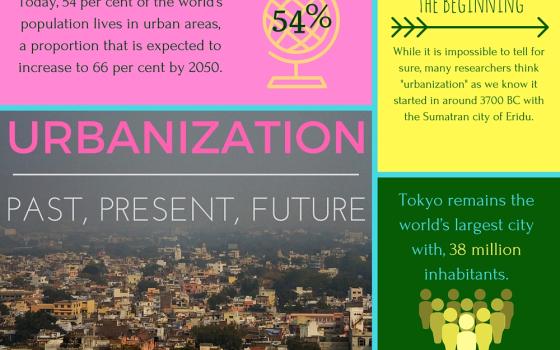
Infographic created by Georgia Perry using Canva with data from Scientific Study and the United Nations.

by Georgia Perry
"In order to understand the current era of urbanization, we must understand long-term historical urbanization trends and patterns." So argue the authors of a new study in Scientific Data, who painstakingly combed through centuries of historical, archaeological, and census-based data on urban populations to create an archive of the location and size of urban populations spanning the past 6,000 years. Max Galka from Metrocosm then turned the results into a thrilling interactive map that lets users watch as cities blossom across a world map while a timeline scrolls through the centuries. The most startling change can be seen at around 1900 with the onset of the Industrial Revolution, when people throughout the developed world moved to cities en masse.
As we move forward in life as stewards for each other and for our planet, it's vital to understand the impacts of urbanization on both a social and an environmental scale. The data compiled in this study helps give a sense of human interactions with the environment over time — a topic that couldn't be more timely for us at Global Sisters Report, as we continue our ongoing series on landfills and how they affect both people and the planet.
This week we feature Metrocosm's map, and our #3Stats come from the Scientific Data study as well as the United Nations.
[Georgia Perry is a freelance writer based in Oakland, California. She's contributed to several print and online magazines including, The Atlantic, CityLab, Portland Monthly Magazine and the Portland Mercury. She was formerly a staff writer at the Santa Cruz Weekly in California. Follow her on Twitter @georguhperry.]